Grey Matter 报告:同等 B2B Google Ads 搜索关键词点击成本同比上涨约 21%
Same B2B Google Ads Keywords Cost About 21% More, Agency Data Shows via @sejournal, @MattGSouthern
数字营销机构 Grey Matter 发布的报告显示,在控制支出变动、广告排名和质量得分后,14 家 B2B 广告主的同等 Google Ads 非品牌搜索关键词每次点击费用(CPC)同比上涨约 21%,可能范围在 1% 至 44% 之间。
原文通过回归模型剔除了预算与质量得分变化的影响,为评估 B2B 搜索广告实际点击成本上涨提供了量化参照。
To determine how much more the same non-branded Google Ads keywords cost 14 B2B advertisers per click during the months of April through September compared to the same time period last year, Grey Matter reviewed their Google Ads Search campaigns.
According to the agency report by Grey Matter issued in October, there was an increase of about 21% in cost-per-click (CPC) for the same keywords used by these 14 B2B advertisers, after accounting for changes in their spending, ad position and Quality Score. The report gives a likely range of 1% to 44% for that figure. It is based on client Google Ads Search campaign data only, so it does not include Performance Max, Shopping or Display campaigns. All 14 come from the agency’s client base, and its search team runs SEO and paid search programs for B2B companies.
Andy Hendricks, Grey Matter’s head of search, writes that he wanted to isolate what portion of the overall price change all advertisers experienced versus what portion was due to actions taken by each advertiser individually. Most available CPC benchmarks, such as published averages, do not account for this differentiation and simply provide an overall average CPC.
How The Report Measured The Same Click
Grey Matter excluded broad match keywords since the searches they get matched to can change over time; keywords within Maximize Clicks campaigns also do not fit into the analysis. Brand and competitor keywords were also excluded from the overall estimate.
Grey Matter’s analysis is based on tracking 1,349 non-brand keywords, each within one account, for six quarters (April 2025 to September 2026). The year-over-year comparison covers April through September 2026 versus those months a year prior.
The headline estimate was derived from a regression model using data from all 14 advertisers in the report which controlled for campaign spend, impression share lost to budget, top-of-page position, and Quality Score. Every advertiser was given equal weight regardless of how much it spends.
With no controls applied, the same keywords cost 29% more year over year. Adding the two spend-related controls lowered that to 22%, and position and Quality Score took it to 21%.
A second estimation technique used in this analysis was a keyword price index. This measure covered 11 advertisers who had sufficient matching keywords from quarter to quarter.
Higher Spend Went With Higher CPCs On The Same Keywords
The report’s regression ties every 10% increase in campaign spend to about 1.4% higher CPCs, on top of the market increase, or roughly 11% for doubled spend. The report doesn’t give a likely range for that figure.
The most extreme case in the sample nearly quadrupled its non-brand Search spend year over year, and its same-keyword CPCs rose 132%. The report says that advertiser’s brand keywords, on a flat budget, rose about 4% year over year in the third quarter.
The report sees a correlation between this pattern and automated bidding. It explains that a campaign using a strategy like Maximize Conversions spends a bigger budget by entering auctions it previously skipped, including higher positions, more competitive searches, and pricier times of day.
What The 11 Advertisers Paid Overall
For the 11 advertisers covered by the keyword price index, the overall year-over-year increase in average non-brand CPC was 36%, including the advertisers’ own choices. Of that, 22 points were attributed to the market, and three additional points were attributed to increased spending. There was a three-point deduction due to various types of keyword, match type and bid strategy changes, leaving 14 points that the report’s first three parts don’t explain.
Grey Matter illustrates that breakdown in the chart below.
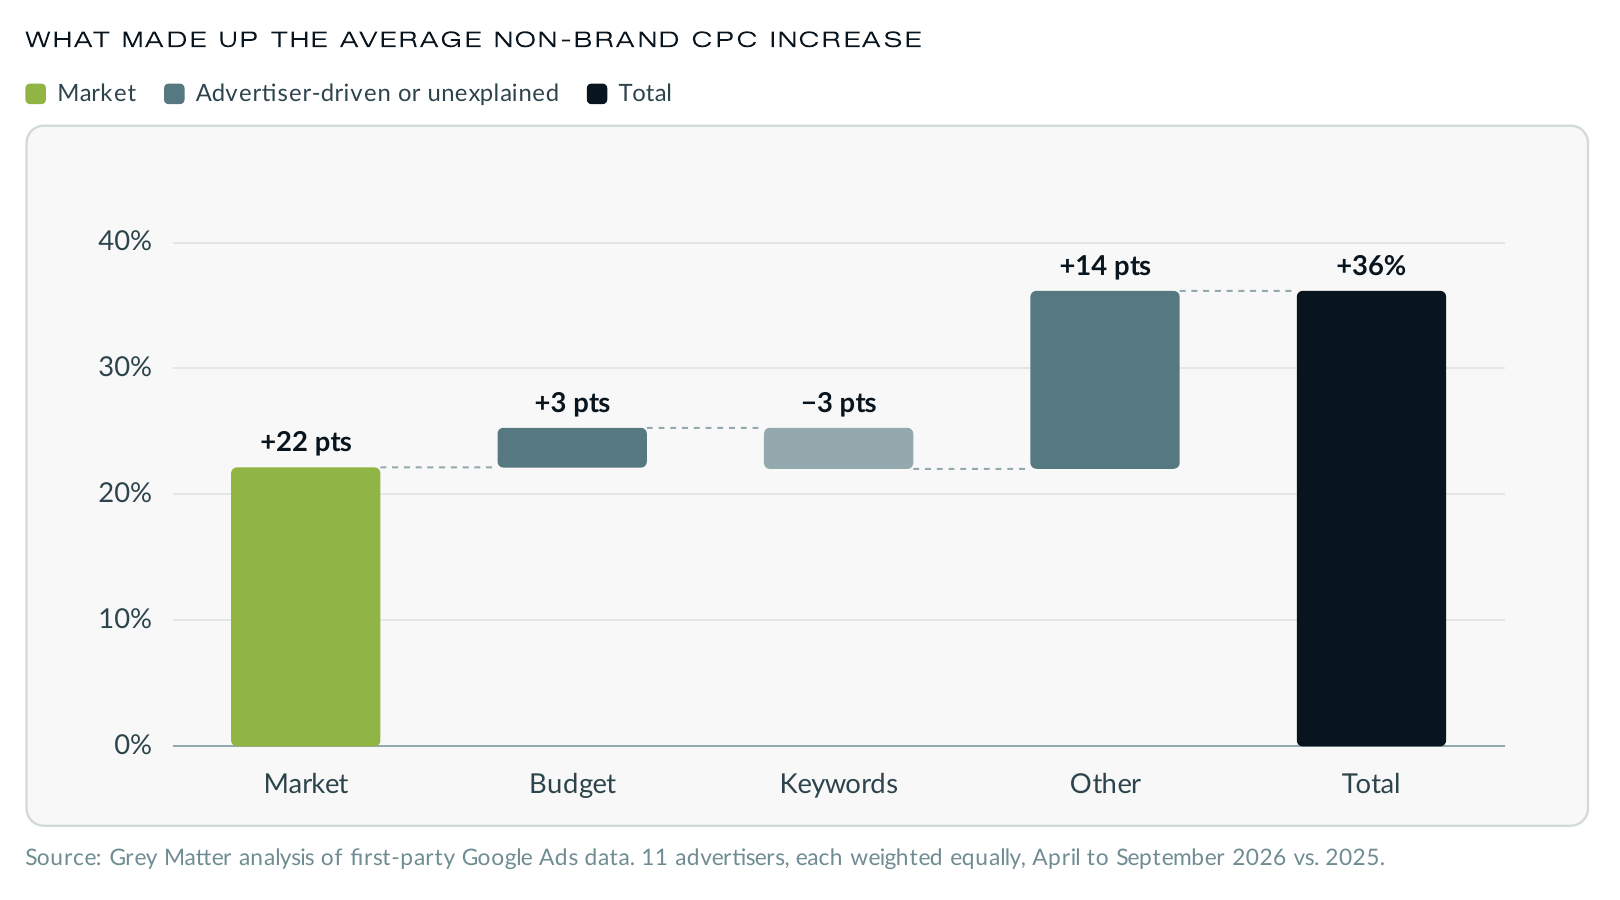
The majority of those 14 points occurred at a few of the advertisers who saw an approximate doubling of their CPCs, which the report said probably represented competition in their respective categories.
Actual CPC changes ranged from a 30% decrease to a 121% increase. Ten of the 11 paid more for the same keywords, and nine paid more overall. One advertiser kept its spending flat and saw the same keywords rise by 20%. After shifting some of its budget to pricier phrase-match keywords, its overall CPC increased by 40%.
How Firm The 21% Is
With only 14 advertisers in this report, the likely range for the 21% estimate is wide. When the biggest spender is removed from the report’s data, the estimate drops to around 17%, and its likely range of -2% to +40% includes zero. When broad match keywords are included, the estimate rises to around 31%. According to Hendricks, compared with a year ago, that same click most likely costs about 20% more currently, and the true figure “could be meaningfully higher or lower”.
The report calls its findings correlation (and not proven causation). There are no references on the report page or in the PDF to the industries or markets of the advertisers used in the report, nor their currency.
The report doesn’t provide any conversion rate or cost per lead information; so, it can’t show whether these advertisers saw better or worse results along with higher CPCs. Jyll Saskin Gales argued in an April column for Search Engine Journal (SEJ) that under Smart Bidding, a high CPC is often a sign of a healthy account, and that accounts should be evaluated based on CPA or ROAS.
Google’s Own CPC Figure Measures Something Else
Alphabet’s third-quarter 10-Q reports that cost-per-click on Google Search & other properties rose 4% year over year in the quarter. Alphabet has defined this metric as click-driven revenue divided by total paid clicks and has cited several factors such as changes in the devices users access the internet on, geography, advertiser spending, and product mix as variables that affect it.
The metric is based on paid clicks through Google Search properties and other platforms owned by Alphabet, so it will track with the price of the clicks and also the mix of clicks being counted. Grey Matter’s estimate instead tracks the same keywords across 14 advertisers.
There is no direct confirmation or contradiction between the two figures since they measure entirely different things.
Why This Matters
Grey Matter’s report holds the keyword and the account constant, while raw CPC averages also rise when advertisers buy different clicks. With 14 clients of one agency and a range from 1% to 44%, the report is a reference point for B2B non-brand Search, not a forecast for any single account.
You can run a same-keyword check on your own account by comparing the year-over-year change in what the same non-brand keywords cost with the change in the account’s average CPC. The report reads the gap between those two as the effect of keyword, match type and bid strategy changes. A same-keyword rise can still include the effect of higher spending.
Looking Ahead
Grey Matter’s data runs through September, so it doesn’t include fourth-quarter auctions. For 2027 budgets, the report’s guidance is to scale them gradually and assess each step by how much the additional clicks cost. For campaigns on automated bidding such as Maximize Conversions, the report also suggests deciding what the additional conversions are worth before raising the budget, and setting a target to match.
Featured Image: Tetiana Yurchenko/Shutterstock
来源:Search Engine Journal · searchenginejournal.com